


Understanding SLIs, SLOs, and SLAs – Understanding Key Performance Indicators (KPIs) for Your Production Service
In the realm of site reliability, three crucial parameters guide SREs: the indicators of availability
– service-level indicators (SLIs), the definition of availability –SLOs, and the consequences of unavailability – service-level agreements (SLAs). Let’s start by exploring SLIs in detail.
SLIs
SLIs serve as quantifiable reliability metrics. Google defines them as “carefully defined quantitative measures of some aspect of the level of service provided.” Common examples include request latency,failure rate, and data throughput. SLIs are specific to user journeys, which are sequences of actions users perform to achieve specific goals. For instance, a user journey for our sample Blog App might involve creating a new blog post.
Google, the original advocate of SRE, has identified four golden signals that apply to most user journeys:
- Latency: This measures the time it takes for your service to respond to user requests
- Errors: This indicates the percentage of failed requests, highlighting issues in service reliability
- Traffic : Traffic represents the demand directed toward your service, reflecting its usage
- Saturation: Saturation assesses how fully your infrastructure components are utilized
One recommended approach by Google to calculate SLIs is by determining the ratio of good events to valid events:
SLI = (Good Events * 100) / Valid Events
A perfect SLI score of 100 implies everything functions correctly, while a score of 0 signifies widespread issues.
A valuable SLI should align closely with the user experience. For example, a lower SLI value should correspond to decreased customer satisfaction. If this alignment is absent, the SLI may not provide meaningful insights or be worth measuring.
Let’s look at the following figure to understand this better:
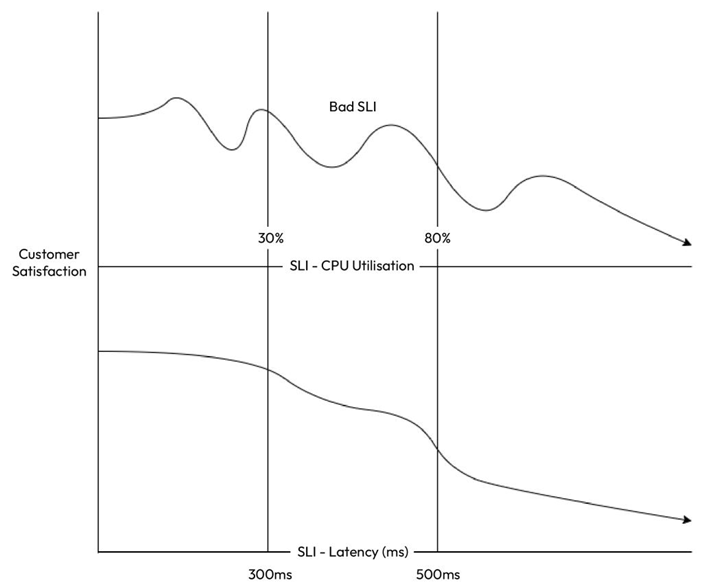
Figure 14.1 – Good versus bad SLI
As we can see, the CPU Utilisation SLI does not reflect customer satisfaction in any way; that is, there is no direct correlation between increasing CPU Utilisation and decreased customer satisfaction except after it crosses the 80% threshold. In contrast, the Latency SLI directly correlates with customer satisfaction, which reduces with increasing latency and significantly after the 300ms and 500ms levels. Therefore, it is a good idea to use Latency as an SLI over CPU Utilization.
It’s also advisable to limit the number of SLIs to a manageable quantity. Too many SLIs can lead to team confusion and trigger numerous false alarms. It’s best to focus on four or five metrics directly linked to customer satisfaction. For instance, instead of monitoring CPU and memory usage, prioritize metrics such as request latency and error rate.
Furthermore, prioritizing user journeys is essential, giving higher importance to journeys that significantly impact customers and lower importance to those with less of a customer impact. For example, ensuring a seamless create and update post experience in our Blog App is more critical than the reviews and ratings service. SLIs alone do not make much sense as they are just measurable indicators. We need to set objectives for SLIs. So, let’s look at SLOs.


Leave a Reply