


Observing traffic and alerting with Istio – Implementing Traffic Management, Security, and Observability with Istio
Istio provides several tools to visualize traffic through our mesh through Istio add-ons. While Prometheus is the central telemetry data collection, storage, and query layer, Grafana and Kiali provide us with interactive graphical tools to interact with that data.
Let’s start this section by installing the observability add-ons using the following commands:
$ cd ~
$ mkdir ~/mdo-environments/manifests/istio-system
$ cd ~/mdo-environments/manifests/istio-system/
$ cp ~/modern-devops/ch15/observability/*.yaml .
$ git add –all
$ git commit -m “Added observability”
$ git push
As soon as we push the code, Argo CD should create a new istio-system namespace and install the add-ons. Once they have been installed, we can start by accessing the Kiali dashboard.
Accessing the Kiali dashboard
Kiali is a powerful observability and visualization tool for microservices and service mesh management. It offers real-time insights into the behavior of your service mesh, helping you monitor and troubleshoot issues efficiently.
As the Kiali service is deployed on a cluster IP and hence not exposed externally, let’s do a port forward to access the Kiali dashboard using the following command:
$ kubectl port-forward deploy/kiali -n istio-system 20001:20001
Once the port forward session has started, click on the web preview icon of Google Cloud Shell, choose Change port to 20001, and click preview. You will see the following dashboard. This dashboard provides valuable insights into the applications running across the mesh:
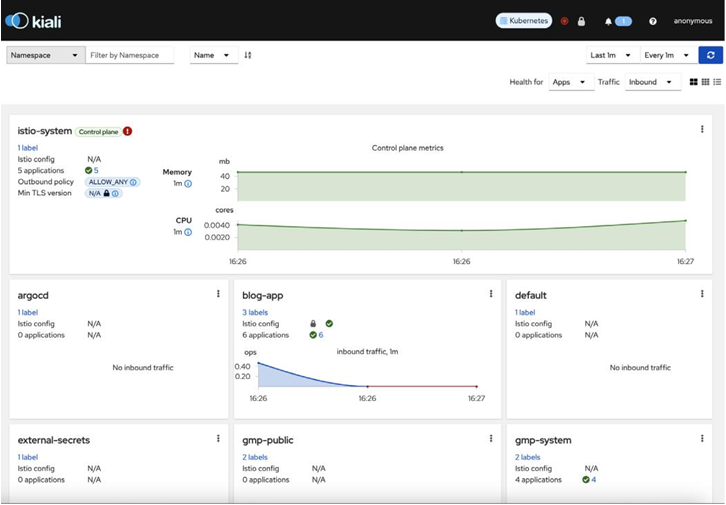
Figure 15.10 – Kiali dashboard
To visualize service interactions, we can switch to the graph view by clicking on the Graph tab and selecting the blog-app namespace. We will see the following dashboard, which provides an accurate view of how traffic flows, the percentage of successful traffic, and other metrics:
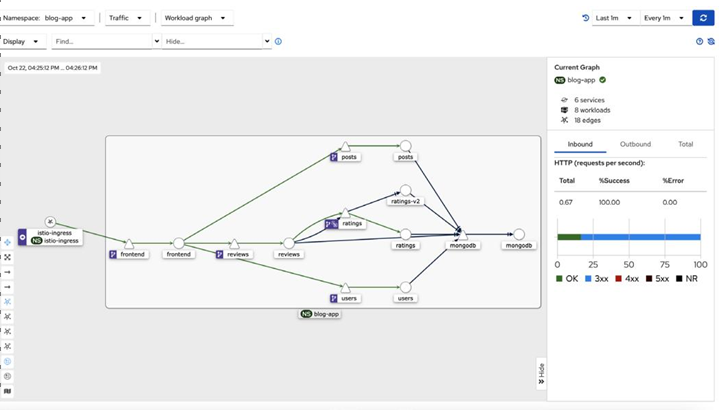
Figure 15.11 – Kiali service interaction graph
While Kiali dashboards provide valuable insights regarding our mesh and help us observe service interactions in real time, they lack the capability of providing us with advanced monitoring and alerting capabilities. For that, we can use Grafana.
Monitoring and alerting with Grafana
Grafana is a leading open source platform for observability and monitoring, offering dynamic dashboards and robust alerting capabilities. It enables users to visualize data from diverse sources while setting up alerts for proactive issue detection.
As we’ve already installed Grafana with the necessary add-ons, let’s access it by opening a port forward session. Ensure you terminate the existing Kiali port-forwarding session or use a different port. Run the following command to do so:
$ kubectl port-forward deploy/grafana -n istio-system 20001:3000
Once the port forwarding session has started, access the Grafana page like we did for Kiali, and go to Home > Dashboards > Istio > Istio Service Dashboard. We should see a dashboard similar to the following:
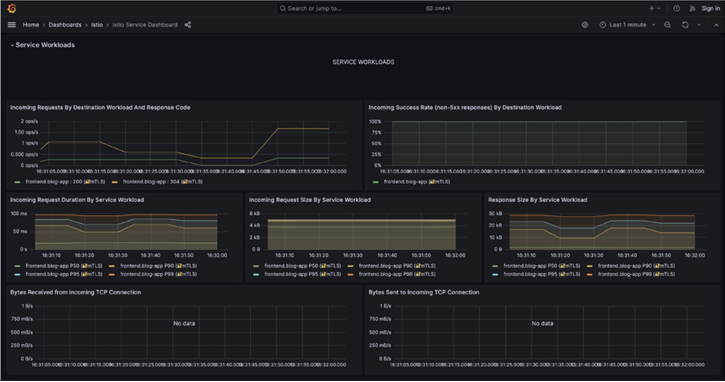
Figure 15.12 – Istio service dashboard
This dashboard provides rich visualizations regarding some standard SLIs we may want to monitor, such as the request’s success rate, duration, size, volume, and latency. It helps you observe your mesh meticulously, and you can also build additional visualizations based on your requirements by using the Prometheus Query Language (PromQL), which is simple to learn and apply.
However, monitoring and visualization must be complemented by alerting for complete reliability.
So, let’s delve into that.


Leave a Reply